


前言
其实本来不想写这篇的,因为这对于前端的入门开发者再简单不过了,只是因为最近看到一位DBA老哥为了生成图表各种折腾,又联想起我原来所在公司的DBA经常找我请教一些自动化流程如何用sql或者plsql实现,实在是忍不住了。
业务报表或者运维报表的自动生成,在一些公司应该是基本操作,开发语言用java的、php的、python的,五花八门,甚至还有直接bat或者shell写静态html的。至于优秀的可视化报表图表平台,更是数不胜数了。只要找个开发问问,没准他几分钟内就帮你搞定了,甚至还可以自动发邮件、企业微信、钉钉等。
找不到开发人员?自己也不会其他开发语言?没关系,HTML总会吧?在数据库里用字符串拼出一个html页面不难吧?
直接上代码
--生成测试数据
create table TEST_AREA_CHART2
(
  sample_time VARCHAR2(8),
  metric_name VARCHAR2(23),
  value       NUMBER
);


insert into test_area_chart2 (SAMPLE_TIME, METRIC_NAME, VALUE)
values ('12:00:00', 'Instance Foreground CPU', 1);

insert into test_area_chart2 (SAMPLE_TIME, METRIC_NAME, VALUE)
values ('12:00:00', 'Instance Background CPU', 4);

insert into test_area_chart2 (SAMPLE_TIME, METRIC_NAME, VALUE)
values ('12:00:00', 'Non-Database Host CPU', 7);

insert into test_area_chart2 (SAMPLE_TIME, METRIC_NAME, VALUE)
values ('12:00:00', 'Load Average', 10);

insert into test_area_chart2 (SAMPLE_TIME, METRIC_NAME, VALUE)
values ('11:00:00', 'Instance Foreground CPU', 2);

insert into test_area_chart2 (SAMPLE_TIME, METRIC_NAME, VALUE)
values ('11:00:00', 'Instance Background CPU', 5);

insert into test_area_chart2 (SAMPLE_TIME, METRIC_NAME, VALUE)
values ('11:00:00', 'Non-Database Host CPU', 8);

insert into test_area_chart2 (SAMPLE_TIME, METRIC_NAME, VALUE)
values ('11:00:00', 'Load Average', 11);

insert into test_area_chart2 (SAMPLE_TIME, METRIC_NAME, VALUE)
values ('10:00:00', 'Instance Foreground CPU', 3);

insert into test_area_chart2 (SAMPLE_TIME, METRIC_NAME, VALUE)
values ('10:00:00', 'Instance Background CPU', 6);

insert into test_area_chart2 (SAMPLE_TIME, METRIC_NAME, VALUE)
values ('10:00:00', 'Non-Database Host CPU', 9);

insert into test_area_chart2 (SAMPLE_TIME, METRIC_NAME, VALUE)
values ('10:00:00', 'Load Average', 12);

commit;

--创建一个HTML生成函数
create function test_area_chart_func return clob is
  l_clob   clob;
  l_legend varchar2(32000);
  l_xAxis  varchar2(32000);
  l_series varchar2(32000);
begin
  l_clob := q'{
<!DOCTYPE html>
<html style="height: 100%">
<head><meta charset="utf-8"></head>
<body style="height: 100%; margin: 0">
<div id="container" style="height: 100%"></div>
<script type="text/javascript" src="https://cdn.jsdelivr.net/npm/echarts@5.2.2/dist/echarts.min.js"></script>
<script type="text/javascript">
var dom = document.getElementById("container");
var myChart = echarts.init(dom);
var app = {};
var option;
option = {title: {text: 'Stacked Area Chart'},
tooltip: {
trigger: 'axis',
axisPointer: {type: 'cross',label: {backgroundColor: '#6a7985'}}},
legend: {data: [##legend##]},
toolbox: {feature: {saveAsImage: {}}},
grid: {left: '3%',right: '4%',bottom: '3%',containLabel: true},
xAxis: [{type: 'category',boundaryGap: false,data: [##xAxis##]}],
yAxis: [{type: 'value'}],
series: [##series##]
};
if (option && typeof option === 'object') {
myChart.setOption(option);
}
</script>
</body>
</html>}';
  select listagg(distinct '''' || a.sample_time || '''', ',') within GROUP(order by sample_time) g
    into l_xAxis
    from test_area_chart2 a;
  select listagg(distinct '''' || a.METRIC_NAME || '''', ',')
    into l_legend
    from test_area_chart2 a;

  select listagg(a)
    into l_series
    from (select q'{ {name: '}' || METRIC_NAME ||
                   q'{',type: 'line',stack: 'Total',areaStyle: {},data: [}' ||
                 listagg(value, ',') within GROUP(order by sample_time) || q'{]} ,}' a
            from test_area_chart2
           where metric_name <> 'Load Average'
           group by METRIC_NAME
          union all
          select q'{ {name: '}' || METRIC_NAME ||
                   q'{',type: 'line',stack: 'Total',data: [}' ||
                 listagg(value, ',') within GROUP(order by sample_time) || q'{]} }'
            from test_area_chart2
           where metric_name = 'Load Average'
           group by METRIC_NAME);

  l_clob := replace(l_clob, '##legend##', l_legend);
  l_clob := replace(l_clob, '##xAxis##', l_xAxis);
  l_clob := replace(l_clob, '##series##', l_series);
  return l_clob;
end;
/

--获取函数返回的html页面
select test_area_chart_func from dual;
页面效果
https://www.darkathena.top/test/test_area_chart.html
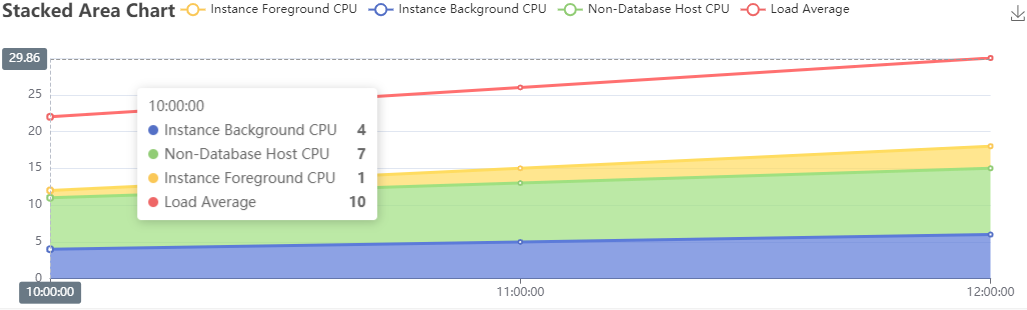
实现原理就是调用开源的图表js组件echarts,手动拼个html。
上面这个函数也就随手一写,主要是验证其可行性,没有针对特殊场景做兼容开发。如果功能要更加全面的话,完全可以把各种选项参数化,封装成一个具有完整功能的plsql包。而且在12c以后也不需要使用字符串拼接json了,直接可以用json语法操作,甚至在21c版本还可以用dbms_mle功能调用js直接返回对应的图片。就算不是21c版本,在ORACLE的apex里写写简单的代码也是可以实现的,甚至还能直接做成动态刷新的页面。最后再搞个大屏显得高大上。
最后提个问题
DBA是否应该至少掌握一门除plsql以外的开发语言?
严格来说,我不是DBA,也不是开发岗位,在之前公司主要是做erp软件运维及业务咨询。由于遇到了和Tim Hall老哥类似的原因
You end up spending loads of time doing things that you are crap at, because your “crap” is better than other people’s “good”
我尝试自己开发各种工具来补齐IT部门工作中的短板,当时的确是没有开发人员,只能自己上(吐槽一下,近十万员工的公司连开发都找不到。。。),所以咨询、设计、开发、运维一个人“全栈”了。而实践证明,懂运维的人开发的运维工具,会比不经常运维的开发人员开发出来的工具用起来更顺手。
所以我对这个问题的回答是,DBA们利用空闲时间去多掌握一门对自己工作有帮助的技能,何乐而不为呢?